Visualizing Middleware Topologies
The other day I was writing about how OracleAS supports multiple JVMs (
http://mike-lehmann.blogspot.com/2006/09/scaling-oracleas-with-multiple-jvms.html
) and you will have seen in the pictures (http://photos1.blogger.com/blogger2/3046/4153/1600/jvm.gif and http://photos1.blogger.com/blogger2/3046/4153/1600/ascjvm.gif ) ASControl provides simple configurability and simple viewing of the number of JVMs per OC4J.
One thing that would be nice to see in the above situation *and* is not in the OracleAS Control 10.1.3 is a local topology viewer (it was available in 10.1.2.0.2). In OracleAS 10.1.3, you can get this two ways: 1. Go to Grid Control R2 (http://www.oracle.com/technology/products/oem/index.html) which can manage OracleAS 10.1.3 instances; 2. Look at a very lightweight utility called iHat.
While GridControl is a incredibly powerful management tool, it does bring along a bit of overhead to my laptop as it really is an enterprise management tool designed to manage Databases, OracleAS, Ebusiness Suite, Collaboration Suite and as of recently, a large swath of third party software and hardware providers (BEA WebLogic, WebSphere, .NET, a number of load balancers and firewalls amongst others).
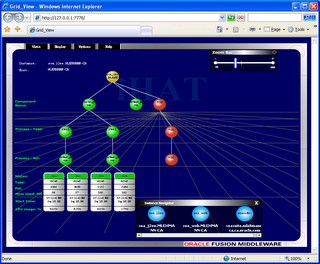
For me wanting to get a quick and dirty topology view - particularly with the multiple JVM feature discussed above - iHat is my favourite lightweight alternative. It is a very lightweight useful tool using Macromedia Flash to visualize the Oracle Application Server topologies. It reads the OracleAS process management environment to construct a view of your basic topology (HTTP server, OC4J’s) but also HTTP request routing relationships and actual runtime processes in the environment. It is downloadable from here - http://www.oracle.com/technology/products/ias/utilities/index.html - a simple zip file that you unzip anywhere, hook it up to a JDK and point it at your OracleAS environment and away you go.
The picture below shows how my OracleAS instance which contains two OC4J instances each with 2 JVMs – the same configuration shown in my previous post. As you can also see you get a quick picture of my overall set of OracleAS instances (soa_j2ee, soasuite and soa_web) each of which I can click on to see a pretty useful visual of what is going on in that instance.
Somewhat even more interesting, you can use this tool to kill processes and see the HA environment in action – whether it be killing the entire instance, a process or a particular JVM. I use this frequently when showing OracleAS HA and how resilient OracleAS is even running stateful applications where it simply routes around any availability issue and also automatically tries to recover any down instances that may have failed for some reason.
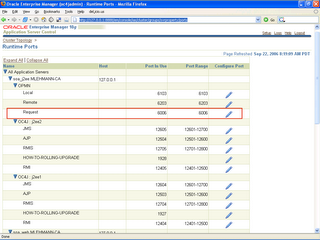
The pointing at the OracleAS environment is pretty straightforward. Aside from needing an installation of the application server (managed version), the main trick is finding out the OPMN request port from which iHat is able to discover the OracleAS. Fortunately in OracleAS 10.1.3.1 the port page for the application server returns like it was there in OracleAS 10.1.2 as shown below:
The port you are looking for is the request port, highlighted here. If you are running a multiple instance environment you will see several request ports - any one will do. Once you have it the steps to start up iHat are shown below - as you have can tell my JDK is located at d:\jdk150, I am running it on my local machine and I chose the instance running in my ORACLE_HOME soasuite:
set JAVA_HOME=d:\jdk150
set PATH=d:\jdk150\bin
set ORACLE_HOME=d:\soasuite
java -classpath %ORACLE_HOME%/opmn/lib/optic.jar;d:\iHAT\ihat.jar oracle.ias.opmn.ihat.WebServer 7778 127.0.0.1:6006
The 6006 port is my request port and 7778 is the port I chose to run iHat on. Once I have done that I simply point my browser at http://localhost:7778 and the iHat tool will appear. This does rely on Flash to be working in your browser which generally is not a problem.
Check it out - a handy tool for visualizing your application server environment :-)
